How to Install the ELK Stack on AWS: A Step-By-Step Guide
来源:互联网 发布:idc虚拟主机源码 编辑:程序博客网 时间:2024/05/19 20:47
http://logz.io/blog/install-elk-stack-amazon-aws/
The ELK Stack is a great open-source stack for log aggregation and analytics. It stands for Elasticsearch (a NoSQL database and search server), Logstash (a log shipping and parsing service), and Kibana (a web interface that connects users with the Elasticsearch database and enables visualization and search options for system operation users). With a large open-source community, ELK has become quite popular, and it is a pleasure to work with.
In this article, we will guide you through the simple ELK installation process on Amazon Web Services.
The following instructions will lead you through the steps involved in creating a working sandbox environment. Due to the fact that a production setup is more comprehensive, we decided to elaborate on how each component configuration should be changed to prepare for use in a production environment.
We’ll start by describing the environment, then we’ll walk through how each component is installed, and finish by configuring our sandbox server to send its system logs to Logstash and view them via Kibana.
Note: All of the ELK components need Java to work, so we will have to install a Java Development Kit (JDK) first.
The AWS Environment
We ran this tutorial on a single AWS Ubuntu 14.04 server (ami-d05e75b8 in US-East zone) on an m4.large instance using its local storage. We started an EC2 instance in the public subnet of a VPC, and then we set up the security group (firewall) to enable access from anywhere using SSH and TCP 5601 (Kibana). Finally, we added a new elastic IP address and associated it with our running instance in order to connect to the internet.
Production tip: A production installation needs at least three EC2 instances — one per component, each with an attached EBS SSD volume.
Step-by-Step ELK Installation
To start, connected to the running server via SSH: ssh ubuntu@YOUR_ELASTIC_IP
Package installations
Prepare the system by running:
- sudo apt-get update
- sudo apt-get upgrade
Install OpenJDK
All of the packages we are going to install require Java. Both OpenJDK and Oracle Java are supported, but installing OpenJDK is simpler:
- sudo apt-get install openjdk-7-jre-headless
Verify that Java is installed:
- java -version
If the output of the previous command is similar to this, then you’ll know that you’re heading in the right direction:
- java version "1.7.0_79"
- OpenJDK Runtime Environment (IcedTea 2.5.5) (7u79-2.5.5-0ubuntu0.14.04.2)
- OpenJDK 64-Bit Server VM (build 24.79-b02, mixed mode)
You can set up your own ELK stack using this guide or try out our simple ELK as a Service solution.
Elasticsearch Installation
Elasticsearch is a widely used database and search server, and it’s the main component of the ELK setup.
Elasticsearch’s benefits include:
- Easy installation and use
- A powerful internal search technology (Lucene)
- A RESTful web interface
- The ability to work with data in schema-free JSON documents (noSQL)
- Open source
To begin the process of installing Elasticsearch, add the following repository key:
- wget -qO - https://packages.elastic.co/GPG-KEY-elasticsearch | sudo apt-key add -
Add the following Elasticsearch list to the key:
- echo "deb http://packages.elastic.co/elasticsearch/1.7/debian stable main" | sudo tee -a /etc/apt/sources.list.d/elasticsearch-1.7.list
- sudo apt-get update
Install:
- sudo apt-get install elasticsearch
Start service:
- sudo service elasticsearch restart
Test:
- curl localhost:9200
If the output is similar to this, then you will know that Elasticsearch is running properly:
- {
- "status" : 200,
- "name" : "Jigsaw",
- "cluster_name" : "elasticsearch",
- "version" : {
- "number" : "1.7.1",
- "build_hash" : "b88f43fc40b0bcd7f173a1f9ee2e97816de80b19",
- "build_timestamp" : "2015-07-29T09:54:16Z",
- "build_snapshot" : false,
- "lucene_version" : "4.10.4"
- },
- "tagline" : "You Know, for Search"
- }
In order to make the service start on boot run:
- sudo update-rc.d elasticsearch defaults 95 10
Production tip: DO NOT open any other ports, like 9200, to the world! There are many bots that search for 9200 and execute groovy scripts to overtake machines.
Logstash Installation
 Logstash is an open-source tool that collects, parses, and stores logs for future use and makes rapid log analysis possible. Logstash is useful for both aggregating logs from multiple sources, like a cluster of Docker instances, and parsing them from text lines into a structured format such as JSON. In the ELK Stack, Logstash uses Elasticsearch to store and index logs.
To begin the process of installing Logstash, add the following Elasticsearch list:
- echo "deb http://packages.elasticsearch.org/logstash/1.5/debian stable main" | sudo tee -a /etc/apt/sources.list
- sudo apt-get update
Then, install the service, have it start on boot, and run:
- sudo apt-get install logstash
- sudo update-rc.d logstash defaults 97 8
- sudo service logstash start
To make sure it runs, execute the following command:
- sudo service logstash status
The output should be:
- logstash is running
Redirect System Logs to Logstash
Create the following file:
/etc/logstash/conf.d/10-syslog.conf
You will have to use Sudo to write in this directory:
- input {
- file {
- type => "syslog"
- path => [ "/var/log/messages", "/var/log/*.log" ]
- }
- }
- output {
- stdout {
- codec => rubydebug
- }
- elasticsearch {
- host => "localhost" # Use the internal IP of your Elasticsearch server
- # for production
- }
- }
This file tells Logstash to store the local syslog ‘/var/log/syslog’ and all the files under ‘/var/log*.log’ inside the Elasticsearch database in a structured way.
The input section specifies which files to collect (path) and what format to expect (syslog). The output section uses two outputs – stdout and elasticsearch. The stdout output is used to debug Logstash – you should find nicely-formatted log messages under ‘/var/log/logstash/logstash.stdout’. The elasticsearch output is what actually stores the logs in Elasticsearch.
In this example, we are using localhost for the Elasticsearch hostname. In a real production setup, however, the Elasticsearch hostname would be different because Logstash and Elasticsearch should be hosted on different machines.
Production tip: Running Logstash and Elasticsearch is a very common pitfall of the ELK stack and often causes servers to fail in production. You can read some more tip on how to install ELK in production.
Finally, restart Logstash to reread its configuration:
- sudo service logstash restart
You can set up your own ELK stack using this guide or try out our simple ELK as a Service solution.
Kibana Installation
![]() Kibana is an open-source data visualization plugin for Elasticsearch. It provides visualization capabilities on top of the content indexed on an Elasticsearch cluster. Users can create bar, line, and scatter plots; pie charts; and maps on top of large volumes of data.
Kibana is an open-source data visualization plugin for Elasticsearch. It provides visualization capabilities on top of the content indexed on an Elasticsearch cluster. Users can create bar, line, and scatter plots; pie charts; and maps on top of large volumes of data.
Among other uses, Kibana makes working with logs easy. Its graphical web interface even lets beginning users execute powerful log searches.
To begin the process of installing Kibana, download the following binary with this command:
- wget https://download.elastic.co/kibana/kibana/kibana-4.1.1-linux-x64.tar.gz
Extract it:
- tar -xzf kibana-4.1.1-linux-x64.tar.gz
- cd kibana-4.1.1-linux-x64/
Move the files to ‘/opt’, create a service file, and have it start on boot:
- sudo mkdir -p /opt/kibana
- sudo mv kibana-4.1.1-linux-x64/* /opt/kibana
- cd /etc/init.d && sudo wget https://raw.githubusercontent.com/akabdog/scripts/master/kibana4_init -O kibana4
- sudo chmod +x /etc/init.d/kibana4
- sudo update-rc.d kibana4 defaults 96 9
- sudo service kibana4 start
Test: Point your browser to ‘http://YOUR_ELASTIC_IP:5601’ after Kibana is started.
You should see a page similar to this:
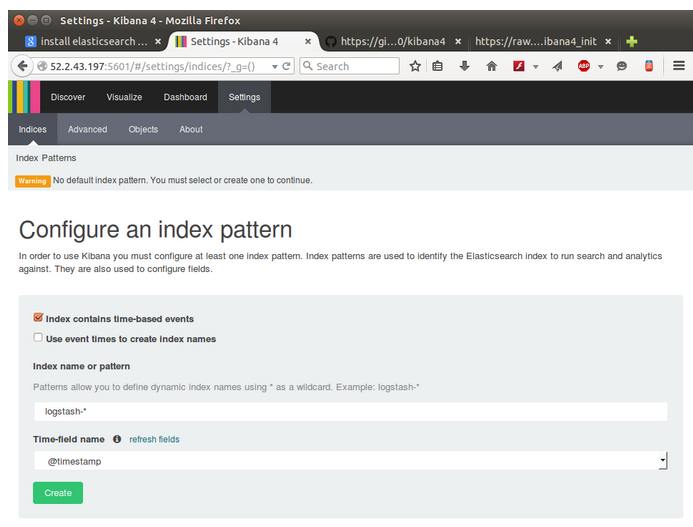
Before continuing with the Kibana setup, you must configure an Elasticsearch index pattern.
What does an “index pattern” mean, and why do we have to configure it? Logstash creates a new Elasticsearch index (database)every day. The names of the indices look like this: logstash-YYYY.MM.DD — for example, “logstash-2015.09.10” for the index that was created on September 10, 2015.
Kibana works with these Elasticsearch indices, so it needs to know which ones to use. The setup screen provides a default pattern, ‘logstash-*’, that basically means “Show the logs from all of the dates.”
Clicking the “Create” button creates the pattern and enables Kibana to find the logs.
Production tip: In this tutorial, we are accessing Kibana directly through its application server on port 5601, but in a production environment you might want to put a reverse proxy server, like Nginx, in front of it.
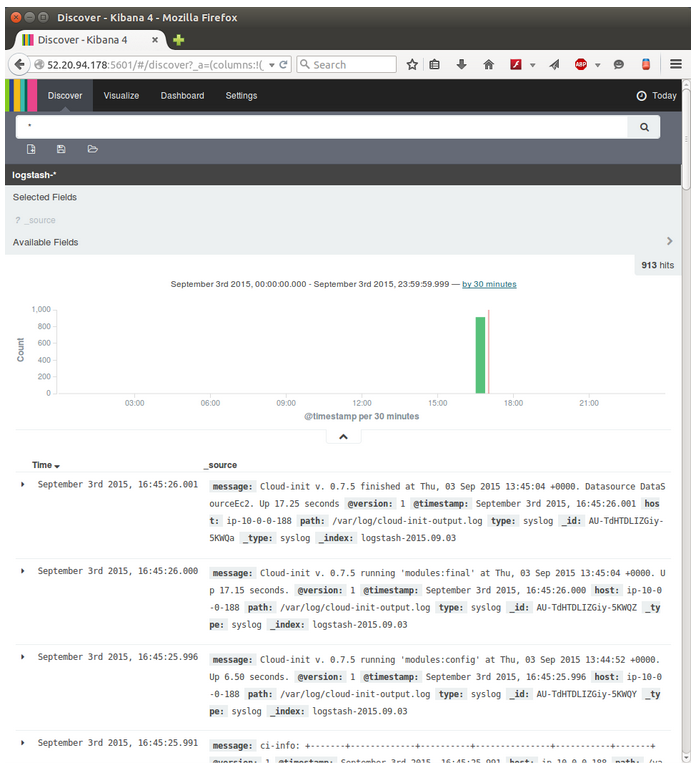
To configure Kibana to show the logs:
1. Go to the Kibana configuration page
2. Click on “Create”
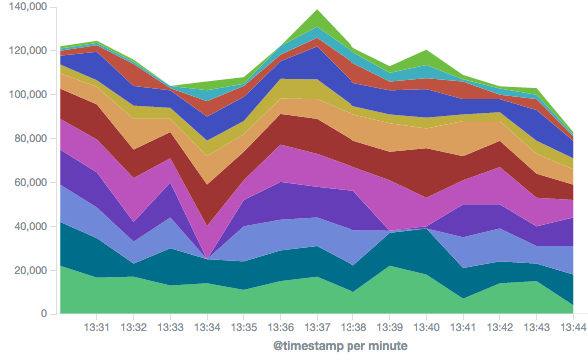
3. Click on “Discover” in the navigation bar to find your log
The result should look like this:
As you can see, creating a whole pipeline of log shipping, storing, and viewing is not such a tough task. In the past, storing, and analyzing logs was an arcane art that required the manipulation of huge, unstructured text files. But the future looks much brighter and simpler.
- How to Install the ELK Stack on AWS: A Step-By-Step Guide
- How to Read and Understand a Scientific Paper: A Step-by-Step Guide for Non-Scientists
- OpenCV on Mac OSX: A step-by-step guide
- Step by step instructions to install NodeJS on Windows
- Step-by-step Install Guide for Ubuntu
- How to write a product backlog step by step
- Install Oracle on RHEL5 - step by step
- A step-by-step guide to the use of the Intel OpenCV library and the Microsoft DirectShow technology
- How to fix bugs, step by step
- Running OpenBTS with the Nuand bladeRF on Ubuntu (The Definitive and Step by Step Guide)
- Step-by-step guide on File-to-IDoc using SAP PI 7.0
- how to insert a talbe making the no asc by one step
- Counter Hack Reloaded: A Step-by-Step Guide to Computer Attacks and Effective Defenses
- A Simple Step-By-Step Guide To Apache Tomcat SSL Configuration
- A Simple Step-By-Step Guide To Apache Tomcat SSL Configuration
- Step by Step Guide to Add a SQL Job in SQL Server 2005
- Beginner’s Guide to ALE and IDocs – a step-by-step approach
- step by step install Oracle RAC on AIX
- MyEclipse过期处理方法
- springmvc与content-type
- 蒙特卡罗方法入门
- Flask项目集成富文本编辑器UEditor 基于蓝图模式下
- 孙剑亲自撰文:我在 Face++ 的这半年
- How to Install the ELK Stack on AWS: A Step-By-Step Guide
- c#遍历list<>并删除某个元素
- ADAS技术概要
- Java Action配置
- 好玩的代码注释模板
- matlab find() 用法
- oracle中delete drop truncate的用法和区别
- 修改公网网卡,子网或网络掩码信息
- 在制定seo计划之前要确定网站用户需求