8 Command Line Tools to Monitor Linux Performance
来源:互联网 发布:seo外包服务seouh 编辑:程序博客网 时间:2024/06/10 16:42
It’s really very tough job for every System or Network administrator to monitor and debugLinux System Performance problems every day. After being a Linux Administrator for 5 years in IT industry, I came to know that how hard is to monitor and keep systems up and running. For this reason, we’ve compiled the list of Top 8 frequently used command line monitoring tools that might be useful for every Linux/Unix System Administrator. These commands are available under all flavors of Linux and can be useful to monitor and find the actual causes of performance problem. This list of commands shown here are very enough for you to pick the one that is suitable for your monitoring scenario.

8 Linux Command Line Performance Monitoring Tools
1. Top – Linux Process Monitoring
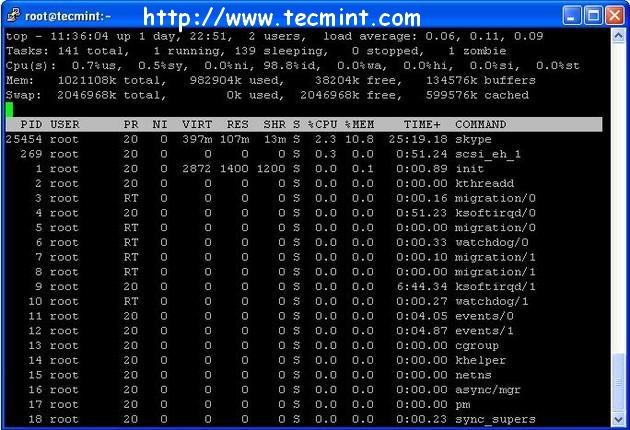
Linux Top command is a performance monitoring program which is used frequently by many system administrators to monitor Linux performance and it is available under many Linux/Unixlike operating systems. The top command used to dipslay all the running and active real-time processes in ordered list and updates it regularly. It display CPU usage, Memory usage, Swap Memory, Cache Size, Buffer Size, Process PID, User, Commands and much more. It also shows high memory and cpu utilization of a running processess. The top command is much userful for system administrator to monitor and take correct action when required. Let’s see top command in action.
# top

Top Command Example
For more examples of Top command read : 12 TOP Command Examples in Linux
2. VmStat – Virtual Memory Statistics
Linux VmStat command used to display statistics of virtual memory, kernerl threads, disks,system processes, I/O blocks, interrupts, CPU activity and much more. By default vmstat command is not available under Linux systems you need to install a package called sysstat that includes a vmstat program. The common usage of command format is.
# vmstatprocs -----------memory---------- ---swap-- -----io---- --system-- -----cpu----- r b swpd free inact active si so bi bo in cs us sy id wa st 1 0 0 810420 97380 70628 0 0 115 4 89 79 1 6 90 3 0For more Vmstat examples read : 6 Vmstat Command Examples in Linux
3. Lsof – List Open Files
Lsof command used in many Linux/Unix like system that is used to display list of all the open files and the processes. The open files included are disk files, network sockets, pipes,devices and processes. One of the main reason for using this command is when a disk cannot be unmounted and displays the error that files are being used or opened. With this commmand you can easily identify which files are in use. The most common format for this command is.
# lsofCOMMAND PID USER FD TYPE DEVICE SIZE NODE NAMEinit 1 root cwd DIR 104,2 4096 2 /init 1 root rtd DIR 104,2 4096 2 /init 1 root txt REG 104,2 38652 17710339 /sbin/initinit 1 root mem REG 104,2 129900 196453 /lib/ld-2.5.soinit 1 root mem REG 104,2 1693812 196454 /lib/libc-2.5.soinit 1 root mem REG 104,2 20668 196479 /lib/libdl-2.5.soinit 1 root mem REG 104,2 245376 196419 /lib/libsepol.so.1init 1 root mem REG 104,2 93508 196431 /lib/libselinux.so.1init 1 root 10u FIFO 0,17 953 /dev/initctlMore lsof command usage and examples : 10 lsof Command Examples in Linux
4. Tcpdump – Network Packet Analyzer
Tcpdump one of the most widely used command-line network packet analyzer or packets sniffer program that is used capture or filter TCP/IP packets that received or transferred on a specific interface over a network. It also provides a option to save captured packages in a file for later analysis. tcpdump is almost available in all major Linux distributions.
# tcpdump -i eth0tcpdump: verbose output suppressed, use -v or -vv for full protocol decodelistening on eth0, link-type EN10MB (Ethernet), capture size 96 bytes22:08:59.617628 IP tecmint.com.ssh > 115.113.134.3.static-mumbai.vsnl.net.in.28472: P 2532133365:2532133481(116) ack 3561562349 win 964822:09:07.653466 IP tecmint.com.ssh > 115.113.134.3.static-mumbai.vsnl.net.in.28472: P 116:232(116) ack 1 win 964822:08:59.617916 IP 115.113.134.3.static-mumbai.vsnl.net.in.28472 > tecmint.com.ssh: . ack 116 win 64347For more tcpdump usage read : 12 Tcpdump Command Examples in Linux
5. Netstat – Network Statistics
Netstat is a command line tool for monitoring incoming and outgoing network packets statistics as well as interface statistics. It is very useful tool for every system administrator to monitor network performance and troubleshoot network related problems.
# netstat -a | moreActive Internet connections (servers and established)Proto Recv-Q Send-Q Local Address Foreign Address Statetcp 0 0 *:mysql *:* LISTENtcp 0 0 *:sunrpc *:* LISTENtcp 0 0 *:realm-rusd *:* LISTENtcp 0 0 *:ftp *:* LISTENtcp 0 0 localhost.localdomain:ipp *:* LISTENtcp 0 0 localhost.localdomain:smtp *:* LISTENtcp 0 0 localhost.localdomain:smtp localhost.localdomain:42709 TIME_WAITtcp 0 0 localhost.localdomain:smtp localhost.localdomain:42710 TIME_WAITtcp 0 0 *:http *:* LISTENtcp 0 0 *:ssh *:* LISTENtcp 0 0 *:https *:* LISTENMore Netstat examples : 20 Netstat Command Examples in Linux.
6. Htop – Linux Process Monitoring
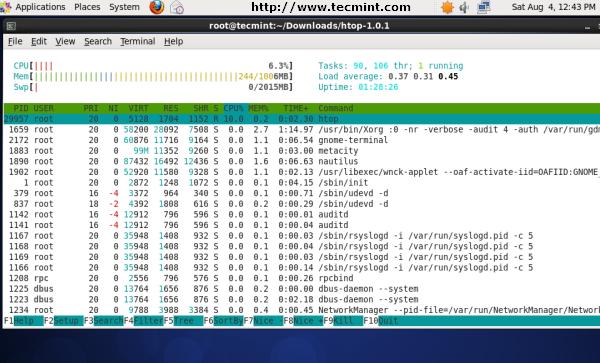
Htop is a much advanced interactive and real time Linux process monitoring tool. This is much similar to Linux top command but it has some rich features like user friendly interface to manage process, shortcut keys, vertical and horizontal view of the processes and much more. Htop is a third party tool and doesn’t included in Linux systems, you need to install it using YUM package manager tool. For more information on installation read our article below.
# htop
Htop Command Example Screenshot
For Htop installation read : Install Htop (Linux Process Monitoring) in Linux
7. Iotop – Monitor Linux Disk I/O
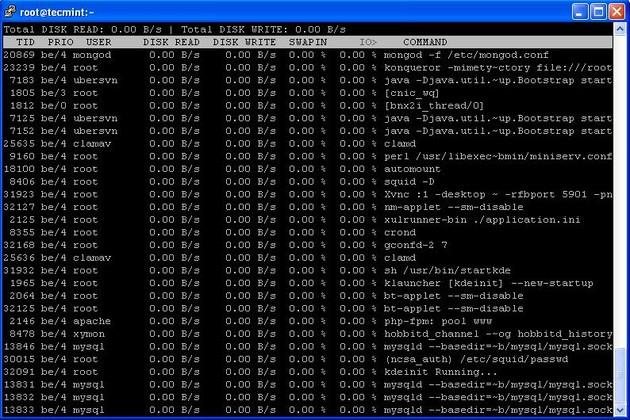
Iotop is also much similar to top command and Htop program, but it has accounting function to monitor and display real time Disk I/O and processes. This tool is much useful for finding the exact process and high used disk read/writes of the processes.
# iotop
Iotop Command Example Screenshot
For Ioptop installation and usage read : Install Iotop in Linux
8. Iostat – Input/Output Statistics
IoStat is simple tool that will collect and show system input and output storage device statistics. This tool is often used to trace storage device performance issues including devices, local disks, remote disks such as NFS.
# iostatLinux 2.6.18-238.9.1.el5 (tecmint.com) 09/13/2012avg-cpu: %user %nice %system %iowait %steal %idle 2.60 3.65 1.04 4.29 0.00 88.42Device: tps Blk_read/s Blk_wrtn/s Blk_read Blk_wrtncciss/c0d0 17.79 545.80 256.52 855159769 401914750cciss/c0d0p1 0.00 0.00 0.00 5459 3518cciss/c0d0p2 16.45 533.97 245.18 836631746 384153384cciss/c0d0p3 0.63 5.58 3.97 8737650 6215544cciss/c0d0p4 0.00 0.00 0.00 8 0cciss/c0d0p5 0.63 3.79 5.03 5936778 7882528cciss/c0d0p6 0.08 2.46 2.34 3847771 3659776For more Iostat usage and examples visit :
# yum -y install sysstat
- vmstat – Summary information of Memory, Processes, Paging etc.
- iostat – Central Processing Unit (CPU) statistics and input/output statistics for devicesand partitions.
1. List Active and Inactive Memory
In the below example, there are six columns. The significant of the columns are explained in man page of vmstat in details. Most important fields are free under memory and si, so under swap column.
[root@tecmint ~]# vmstat -aprocs -----------memory---------- ---swap-- -----io---- --system-- -----cpu----- r b swpd free inact active si so bi bo in cs us sy id wa st 1 0 0 810420 97380 70628 0 0 115 4 89 79 1 6 90 3 0- Free – Amount of free/idle memory spaces.
- si – Swaped in every second from disk in Kilo Bytes.
- si – Swaped out every second to disk in Kilo Bytes.
Note: If you run vmstat without parameters it’ll displays summary report since system boot.
2. Execute vmstat ‘X’ seconds and (‘N’number of times)
With this command, vmstat execute every two seconds and stop automatically after executing six intervals.
[root@tecmint ~]# vmstat 2 6procs -----------memory---------- ---swap-- -----io---- --system-- -----cpu----- r b swpd free buff cache si so bi bo in cs us sy id wa st 0 0 0 810420 22064 101368 0 0 56 3 50 57 0 3 95 2 0 0 0 0 810412 22064 101368 0 0 0 0 16 35 0 0 100 0 0 0 0 0 810412 22064 101368 0 0 0 0 14 35 0 0 100 0 0 0 0 0 810412 22064 101368 0 0 0 0 17 38 0 0 100 0 0 0 0 0 810412 22064 101368 0 0 0 0 17 35 0 0 100 0 0 0 0 0 810412 22064 101368 0 0 0 0 18 36 0 1 100 0 03. Vmstat with timestamps
vmstat command with -t parameter shows timestamps with every line printed as shown below.
[tecmint@tecmint ~]$ vmstat -t 1 5procs -----------memory---------- ---swap-- -----io---- --system-- -----cpu------ ---timestamp--- r b swpd free buff cache si so bi bo in cs us sy id wa st 0 0 0 632028 24992 192244 0 0 70 5 55 78 1 3 95 1 0 2012-09-02 14:57:18 IST 1 0 0 632028 24992 192244 0 0 0 0 171 514 1 5 94 0 0 2012-09-02 14:57:19 IST 1 0 0 631904 24992 192244 0 0 0 0 195 600 0 5 95 0 0 2012-09-02 14:57:20 IST 0 0 0 631780 24992 192244 0 0 0 0 156 524 0 5 95 0 0 2012-09-02 14:57:21 IST 1 0 0 631656 24992 192244 0 0 0 0 189 592 0 5 95 0 0 2012-09-02 14:57:22 IST4. Statistics of Various Counter
vmstat command and -s switch displays summary of various event counters and memory statistics.
[tecmint@tecmint ~]$ vmstat -s 1030800 total memory 524656 used memory 277784 active memory 185920 inactive memory 506144 free memory 26864 buffer memory 310104 swap cache 2064376 total swap 0 used swap 2064376 free swap 4539 non-nice user cpu ticks 0 nice user cpu ticks 11569 system cpu ticks 329608 idle cpu ticks 5012 IO-wait cpu ticks 79 IRQ cpu ticks 74 softirq cpu ticks 0 stolen cpu ticks 336038 pages paged in 67945 pages paged out 0 pages swapped in 0 pages swapped out 258526 interrupts 392439 CPU context switches 1346574857 boot time 2309 forks5. Disks Statistics
vmstat with -d option display all disks statistics.
[tecmint@tecmint ~]$ vmstat -ddisk- ------------reads------------ ------------writes----------- -----IO------ total merged sectors ms total merged sectors ms cur secram0 0 0 0 0 0 0 0 0 0 0ram1 0 0 0 0 0 0 0 0 0 0ram2 0 0 0 0 0 0 0 0 0 0ram3 0 0 0 0 0 0 0 0 0 0ram4 0 0 0 0 0 0 0 0 0 0ram5 0 0 0 0 0 0 0 0 0 0ram6 0 0 0 0 0 0 0 0 0 0ram7 0 0 0 0 0 0 0 0 0 0ram8 0 0 0 0 0 0 0 0 0 0ram9 0 0 0 0 0 0 0 0 0 0ram10 0 0 0 0 0 0 0 0 0 0ram11 0 0 0 0 0 0 0 0 0 0ram12 0 0 0 0 0 0 0 0 0 0ram13 0 0 0 0 0 0 0 0 0 0ram14 0 0 0 0 0 0 0 0 0 0ram15 0 0 0 0 0 0 0 0 0 0loop0 0 0 0 0 0 0 0 0 0 0loop1 0 0 0 0 0 0 0 0 0 0loop2 0 0 0 0 0 0 0 0 0 0loop3 0 0 0 0 0 0 0 0 0 0loop4 0 0 0 0 0 0 0 0 0 0loop5 0 0 0 0 0 0 0 0 0 0loop6 0 0 0 0 0 0 0 0 0 0loop7 0 0 0 0 0 0 0 0 0 0sr0 0 0 0 0 0 0 0 0 0 0sda 7712 5145 668732 409619 3282 28884 257402 644566 0 126dm-0 11578 0 659242 1113017 32163 0 257384 8460026 0 126dm-1 324 0 2592 3845 0 0 0 0 0 26. Display Statistics in Megabytes
The vmstat displays in Megabytes with parameters -S and M(Uppercase & megabytes). By default vmstat displays statistics in kilobytes.
[root@tecmint ~]# vmstat -S M 1 5procs -----------memory---------- ---swap-- -----io---- --system-- -----cpu----- r b swpd free buff cache si so bi bo in cs us sy id wa st 0 0 0 346 53 476 0 0 95 8 42 55 0 2 96 2 0 0 0 0 346 53 476 0 0 0 0 12 15 0 0 100 0 0 0 0 0 346 53 476 0 0 0 0 32 62 0 0 100 0 0 0 0 0 346 53 476 0 0 0 0 15 13 0 0 100 0 0 0 0 0 346 53 476 0 0 0 0 34 61 0 1 99 0 07. Display CPU and I/O statistics
iostat without arguments displays CPU and I/O statistics of all partitions as shown below.
[root@tecmint ~]# iostatLinux 2.6.32-279.el6.i686 (tecmint.com) 09/03/2012 _i686_ (1 CPU)avg-cpu: %user %nice %system %iowait %steal %idle 0.12 0.01 1.54 2.08 0.00 96.24Device: tps Blk_read/s Blk_wrtn/s Blk_read Blk_wrtnsda 3.59 161.02 13.48 1086002 90882dm-0 5.76 159.71 13.47 1077154 90864dm-1 0.05 0.38 0.00 2576 08. Shows only CPU Statistics
iostat with -c arguments displays only CPU statistics as shown below.
[root@tecmint ~]# iostat -cLinux 2.6.32-279.el6.i686 (tecmint.com) 09/03/2012 _i686_ (1 CPU)avg-cpu: %user %nice %system %iowait %steal %idle 0.12 0.01 1.47 1.98 0.00 96.429. Shows only Disks I/O Statistics
iostat with -d arguments displays only disks I/O statistics of all partitions as shown.
[root@tecmint ~]# iostat -dLinux 2.6.32-279.el6.i686 (tecmint.com) 09/03/2012 _i686_ (1 CPU)Device: tps Blk_read/s Blk_wrtn/s Blk_read Blk_wrtnsda 3.35 149.81 12.66 1086002 91746dm-0 5.37 148.59 12.65 1077154 91728dm-1 0.04 0.36 0.00 2576 010. Shows I/O statistics only of a single device.
By default it displays statistics of all partitions, with -p and device name arguments displays only disks I/O statistics for specific device only as shown.
[root@tecmint ~]# iostat -p sdaLinux 2.6.32-279.el6.i686 (tecmint.com) 09/03/2012 _i686_ (1 CPU)avg-cpu: %user %nice %system %iowait %steal %idle 0.11 0.01 1.44 1.92 0.00 96.52Device: tps Blk_read/s Blk_wrtn/s Blk_read Blk_wrtnsda 3.32 148.52 12.55 1086002 91770sda1 0.07 0.56 0.00 4120 18sda2 3.22 147.79 12.55 1080650 9175211. Display LVM Statistics
With -N (Uppercase) parameter displays only LVM statistics as shown.
[root@tecmint ~]# iostat -NLinux 2.6.32-279.el6.i686 (tecmint.com) 09/03/2012 _i686_ (1 CPU)avg-cpu: %user %nice %system %iowait %steal %idle 0.11 0.01 1.39 1.85 0.00 96.64Device: tps Blk_read/s Blk_wrtn/s Blk_read Blk_wrtnsda 3.20 142.84 12.16 1086002 92466vg_tecmint-lv_root 5.13 141.68 12.16 1077154 92448vg_tecmint-lv_swap 0.04 0.34 0.00 2576 012. iostat version.
With -V (Uppercase) parameter displays version of iostat as shown.
[root@tecmint ~]# iostat -Vsysstat version 9.0.4(C) Sebastien Godard (sysstat orange.fr)Note: vmstat and iostat contains number of columns and flags which may not possible to explain in details. If you want to know more about it you may refer man page of vmstat andiostat. Please share it if you find this article is useful through our comment box below.
- 8 Command Line Tools to Monitor Linux Performance
- 8 Command Line Tools to Monitor Linux Performance
- 15 Command Line Tools to Monitor Linux Performance
- 17 Command Line Tools to Monitor Linux Performance
- 18 Command Line Tools to Monitor Linux Performance
- 20 Command Line Tools to Monitor Linux Performance
- 20 Command Line Tools to Monitor Linux Performance
- 6 Command Line Tools for Linux Performance Monitoring
- Know How to Use Command-line Tools
- Know How to Use Command-Line Tools
- GNU/Linux Command-Line Tools Summary
- Kernel monitor and performance tools
- xcode command line tools
- 安装COmmand Line Tools
- Create Command Line Tools
- Xcode Command Line Tools
- command line tools 安装
- Command Line Tools
- python开发环境配置和简单的使用
- struct pt_regs 中存的内容
- TCP报文格式详解
- memcache 多线程 并发模型
- 存储过程一 存储过程介绍
- 8 Command Line Tools to Monitor Linux Performance
- 满足一定要求的排列组合问题
- Hibernate,struts,spring 教程 工作原理
- TCP报文格式详解
- 触发器一 触发器介绍
- Sencha touch 2 - Store 用法笔记
- Java序列化机制和原理
- 内核态下基于动态感染技术的应用程序执行保护(一 前言)
- 用BOOST_FOREACH简化遍历操作


