Memory Leak Detection Using Windbg
来源:互联网 发布:喜剧演员守望者 知乎 编辑:程序博客网 时间:2024/06/10 15:56
本文摘自(www.codeproject.com/KB/cpp/MemoryLeak.aspx)
Introduction
Memory leak is a time consuming bug often created by C++ developers. Detection of memory leaks is often tedious. Things get worst if the code is not written by you, or if the code base is quite huge.
Though there are tools available in the market that will help you in memory leak detection, most of these tools are not free. I found Windbg as a freeware powerful tool to solve memory leak bugs. At least, we get an idea about the code location which might be suspected to cause memory leaks. COM Interface leaks are out of the scope of this article.
Windbg is a powerful user/kernel space debugger from Microsoft, which can be downloaded and installed from here.
Using Windbg
To start working with Windbg:
- Configure the symbol file path to the Microsoft symbol server “SRV*d:/symbols*http://msdl.microsoft.com/download/symbols”.
- Add your program EXE/DLL PDB (program database) path to the symbol file path.
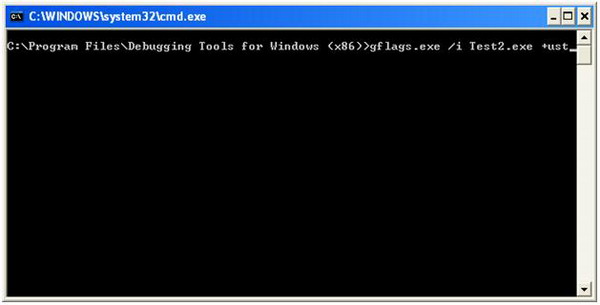
- You also need to to configure the Operating System's flag to enable user stack trace for the process which has memory leaks. This is simple, and can be done with gflags.exe. Gflags.exe is installed during Windbg's installation. This can also be done through command line, using the command “gflags.exe /i MemoryLeak.exe +ust”. My program name is Test2.exe; hence, for the demo, I will be using Test2.exe rather than MemoryLeak.exe. The snapshot below shows the setting of OS flags for the application Test2.exe.
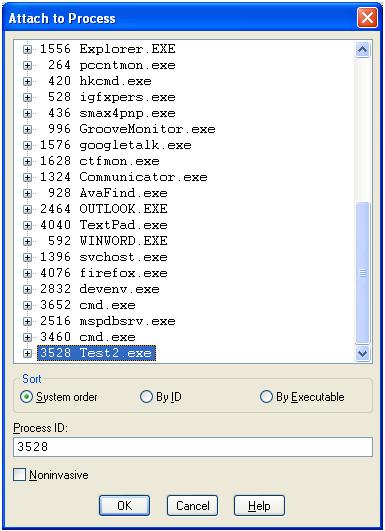
Once we have configured Windbg for the symbol file path, start the process which is leaking memory, and attach Windbg to it. The Attach option in Windbg is available under the File menu, or can be launched using the F6 shortcut. The snapshot below shows the same:
The !heap command of Windbg is used to display heaps. !heap is well documented in the Windbg help.
I have developed a small program which leaks memory, and will demonstrate further using the same.
int _tmain(int argc, _TCHAR* argv[])
{   while(1)
     {
        AllocateMemory();
     }
     return 0;
}
void AllocateMemory()
{
     int* a = new int[2000];
     ZeroMemory(a, 8000);
     Sleep(1);
}
The above program leaks an integer array of size 2000*4 bytes.
After attaching Windbg to the process, execute the !heap –s command. -s stands for summary. Below is the output of the !heap -s for the leaking process:
0:001> !heap -s
NtGlobalFlag enables following debugging aids for new heaps:
    validate parameters
    stack back traces
  Heap     Flags   Reserv  Commit  Virt   Free  List   UCR  Virt  Lock  Fast
                    (k)     (k)    (k)     (k) length      blocks cont. heap
-----------------------------------------------------------------------------
   00150000 58000062    1024     12     12      1     1     1    0      0   L
   00250000 58001062      64     24     24     15     1     1    0      0   L
   00260000 58008060      64     12     12     10     1     1    0      0
   00330000 58001062   64576  47404  47404     13     4     1    0      0
-----------------------------------------------------------------------------
Let the process execute for some time, and then re-break in to the process, and execute !heap -s again. Shown below is the output of the command:
0:001> !heap -s
NtGlobalFlag enables following debugging aids for new heaps:
   validate parameters
   stack back traces
   Heap     Flags   Reserv  Commit  Virt   Free  List   UCR  Virt  Lock  Fast
                     (k)     (k)    (k)     (k) length      blocks cont. heap
   -----------------------------------------------------------------------------
    00150000 58000062    1024     12     12      1     1     1    0      0   L
    00250000 58001062      64     24     24     15     1     1    0      0   L
    00260000 58008060      64     12     12     10     1     1    0      0
    00330000 58001062  261184 239484 239484     14     4     1    0      0
   -----------------------------------------------------------------------------
Lines marked in bold show the growing heap. The above snapshot shows a heap with the handle 00330000 growing.
Execute “!heap -stat –h 00330000” for the growing heap. This command shows the heap statistics for the growing heap. Shown below is the command's output.
0:001> !heap -stat -h 00330000
heap @ 00330000
group-by: TOTSIZE max-display: 20
    size     #blocks     total     ( %) (percent of total busy bytes)
    1f64 76c6 - e905f58  (99.99)
    1800 1 - 1800  (0.00)
    824 2 - 1048  (0.00)
    238 2 - 470  (0.00)
    244 1 - 244  (0.00)
    4c 5 - 17c  (0.00)
    b0 2 - 160  (0.00)
    86 2 - 10c  (0.00)
    50 3 - f0  (0.00)
    74 2 - e8  (0.00)
    38 4 - e0  (0.00)
    48 3 - d8  (0.00)
    c4 1 - c4  (0.00)
    62 2 - c4  (0.00)
    be 1 - be  (0.00)
    b8 1 - b8  (0.00)
    ae 1 - ae  (0.00)
    ac 1 - ac  (0.00)
    55 2 - aa  (0.00)
    a4 1 - a4  (0.00)
The above snapshot shows 0x76c6 blocks of size 1f64 being allocated (marked in bold). Such a huge number of blocks of the same size makes us suspect that these can be leaked blocks. Rest of the block allocations do not have growing block numbers.
The next step is to get the address of these blocks. Use the command !heap -flt s 1f64. This command filters all other blocks of heap and displays the details of blocks having size 1f64.
Shown below is the output for the command:
0:001> !heap -flt s 1f64
    _HEAP @ 150000
    _HEAP @ 250000
    _HEAP @ 260000
    _HEAP @ 330000
      HEAP_ENTRY Size Prev Flags    UserPtr UserSize - state
        003360e0 03f0 0000  [07]   003360e8    01f64 - (busy)
        00338060 03f0 03f0  [07]   00338068    01f64 - (busy)
        00339fe0 03f0 03f0  [07]   00339fe8    01f64 - (busy)
        0033bf60 03f0 03f0  [07]   0033bf68    01f64 - (busy)
        0033dee0 03f0 03f0  [07]   0033dee8    01f64 - (busy)
        01420040 03f0 03f0  [07]   01420048    01f64 - (busy)
        01421fc0 03f0 03f0  [07]   01421fc8    01f64 - (busy)
        01423f40 03f0 03f0  [07]   01423f48    01f64 - (busy)
        01425ec0 03f0 03f0  [07]   01425ec8    01f64 - (busy)
        01427e40 03f0 03f0  [07]   01427e48    01f64 - (busy)
        01429dc0 03f0 03f0  [07]   01429dc8    01f64 - (busy)
        0142bd40 03f0 03f0  [07]   0142bd48    01f64 - (busy)
        0142dcc0 03f0 03f0  [07]   0142dcc8    01f64 - (busy)
        0142fc40 03f0 03f0  [07]   0142fc48    01f64 - (busy)
        01431bc0 03f0 03f0  [07]   01431bc8    01f64 - (busy)
        01433b40 03f0 03f0  [07]   01433b48    01f64 - (busy)
        01435ac0 03f0 03f0  [07]   01435ac8    01f64 - (busy)
        01437a40 03f0 03f0  [07]   01437a48    01f64 - (busy)
        014399c0 03f0 03f0  [07]   014399c8    01f64 - (busy)
        0143b940 03f0 03f0  [07]   0143b948    01f64 - (busy)
        0143d8c0 03f0 03f0  [07]   0143d8c8    01f64 - (busy)
        0143f840 03f0 03f0  [07]   0143f848    01f64 - (busy)
        014417c0 03f0 03f0  [07]   014417c8    01f64 - (busy)
        01443740 03f0 03f0  [07]   01443748    01f64 - (busy)
        014456c0 03f0 03f0  [07]   014456c8    01f64 - (busy)
        01447640 03f0 03f0  [07]   01447648    01f64 - (busy)
        014495c0 03f0 03f0  [07]   014495c8    01f64 - (busy)
        0144b540 03f0 03f0  [07]   0144b548    01f64 - (busy)
        0144d4c0 03f0 03f0  [07]   0144d4c8    01f64 - (busy)
        0144f440 03f0 03f0  [07]   0144f448    01f64 - (busy)
        014513c0 03f0 03f0  [07]   014513c8    01f64 - (busy)
        01453340 03f0 03f0  [07]   01453348    01f64 - (busy)
        014552c0 03f0 03f0  [07]   014552c8    01f64 - (busy)
        01457240 03f0 03f0  [07]   01457248    01f64 - (busy)
        014591c0 03f0 03f0  [07]   014591c8    01f64 - (busy)
        0145b140 03f0 03f0  [07]   0145b148    01f64 - (busy)
        0145d0c0 03f0 03f0  [07]   0145d0c8    01f64 - (busy)
        0145f040 03f0 03f0  [07]   0145f048    01f64 - (busy)
        01460fc0 03f0 03f0  [07]   01460fc8    01f64 - (busy)
        01462f40 03f0 03f0  [07]   01462f48    01f64 - (busy)
        01464ec0 03f0 03f0  [07]   01464ec8    01f64 - (busy)
        01466e40 03f0 03f0  [07]   01466e48    01f64 - (busy)
        01468dc0 03f0 03f0  [07]   01468dc8    01f64 - (busy)
Use any UsrPtr column value from the listed output, and then use the the command !heap -p -a UsrPtr to display the call stack for UsrPtr. I have selected 0143d8c8 marked in bold.
Upon execution of !heap -p -a 0143d8c8, we get the call stack shown below:
0:001> !heap -p -a 0143d8c8
    address 0143d8c8 found in
    _HEAP @ 330000
      HEAP_ENTRY Size Prev Flags    UserPtr UserSize - state
        0143d8c0 03f0 0000  [07]   0143d8c8    01f64 - (busy)
        Trace: 0025
        7c96d6dc ntdll!RtlDebugAllocateHeap+0x000000e1
        7c949d18 ntdll!RtlAllocateHeapSlowly+0x00000044
        7c91b298 ntdll!RtlAllocateHeap+0x00000e64
        102c103e MSVCR90D!_heap_alloc_base+0x0000005e
        102cfd76 MSVCR90D!_heap_alloc_dbg_impl+0x000001f6
        102cfb2f MSVCR90D!_nh_malloc_dbg_impl+0x0000001f
        102cfadc MSVCR90D!_nh_malloc_dbg+0x0000002c
        102db25b MSVCR90D!malloc+0x0000001b
        102bd691 MSVCR90D!operator new+0x00000011
        102bd71f MSVCR90D!operator new[]+0x0000000f
        4113d8 Test2!AllocateMemory+0x00000028
        41145c Test2!wmain+0x0000002c
        411a08 Test2!__tmainCRTStartup+0x000001a8
        41184f Test2!wmainCRTStartup+0x0000000f
        7c816fd7 kernel32!BaseProcessStart+0x00000023
The lines marked in bold shows the functions from our code.
Note: Sometimes, it might happen that the “!heap -s” command does not show a growing heap. In that case, use the “!heap -stat -h” command to list all the heaps with their sizes and number of blocks. Spot the growing number of blocks, and then use the “!heap –flt s SIZE” (SIZE = the size of the suspected block) command.
- Memory Leak Detection Using Windbg
- Memory Leak Detection Using Windbg(windbg检查内存泄漏)
- Enabling Memory Leak Detection
- Android memory leak detection
- Memory Leak Detection in C++
- Memory Leak Detection in .NET
- Memory Leak Detection in C++
- Memory leak detection in C++
- Android memory leak using MAT
- Memory Leak Detection in Embedded Systems
- Memory Leak Detection in Visual Studio
- Memory Leak Detection Enabling in VS.
- (Memory and Resource) Leak detection for WinCE
- Visual Studio 2015 memory leak detection
- Automatic memory leak detection on iOS
- 使用windbg找内存泄露(memory leak)
- 使用windbg找内存泄露(memory leak)
- Visual Leak Detector - Enhanced Memory Leak Detection for Visual C++
- 二分图最大匹配(匈牙利算法)
- 改变自己(转载)
- SET DATEFORMAT对日期处理的影响
- DM642 FVID驱动
- orace的隔离级别
- Memory Leak Detection Using Windbg
- Cisco路由器VPN配置 实验
- Oracle中创建全文索引支持的类型
- OSGI 入门
- 烤箱的故事
- 有关日期
- 从Android联盟看中国企业的国际化
- 正则表达式基础知识
- 异步磁盘 I / O 出现在 Windows NT、 Windows 2000 和 Windows XP 上同步


